1. What is F-score and what is it used for?
I want to understand what methods we use to evaluate the quality of model predictions. I’ve heard that F-score can help, but what is the idea behind this metric?
Let’s introduce the following notations:
TP – True Positive;
TN – True Negative;
FP – is a false positive solution;
FN – is a false negative decision.
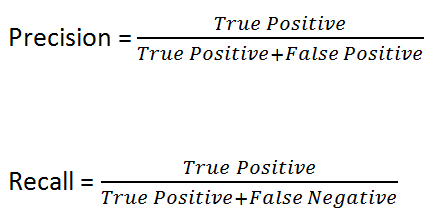
Obviously, the higher the Precision (accuracy) and Recall (completeness), the better. However, in real life, it is impossible to maximise both indicators at the same time. We have to find a balance.
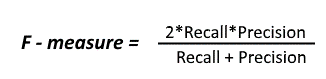
Thus, we need a metric which combines information about accuracy and completeness of our algorithm. It is F-score (otherwise known as F-measure).
2. How do I avoid overfitting the model?
I trained the model, it has perfect performance on the training dataset. But on the test sample, the result deteriorates significantly. I suspect it is overfitting, how to fix the situation?
- Simplify the model – the lower the number of variables, the less “noise” in the training data.
- Use cross-validation techniques (k-fold)
- Use regularisation methods such as LASSO which impose a “penalty” on certain model parameters if they lead to overfitting.
- If possible, train the model on more data.
3. What happens if the training rate is set incorrectly?
I’m thinking about choosing values for the model’s learning rate. I’m afraid to set it wrong, what might happen in that case? And which speed is better: high or low?
If the learning rate is too low, model learning will be extremely slow as we update the weights as little as possible. It will take a long time before the local minimum point is reached.
If the learning rate is too high, it will lead to undesirable behaviour of the loss function due to the abrupt update of weights. In such a case, the model will produce noise instead of the output we want, which is a sign of under-learning.
The most favourable learning rate will be relatively low, so that the model converges to our desired output, but at the same time high enough that it can be trained in a reasonable amount of time.
4. What is logistic regression? Give an example of its use.
Why logistic regression is so popular in machine learning? What is the idea behind it?
Logistic regression is a method of predicting a binary outcome based on a linear combination of features (fics) within our data. It is one of the main machine learning algorithms that used in many fields, such as medicine and banking.
For example, if you want to predict whether a passenger survived the Titanic or not. In this case the prediction result is binary, i.e. 0 or 1 (rescue/death). Features that affect the result are: the gender and age of the passenger, the class of stateroom they sailed in, etc.
5. What is the difference between supervised & unsupervised learning?
I’m not quite sure what the difference is between the two types of machine learning. Aren’t all algorithms the same? After all, in both cases our end result is a working model.
Supervised learning:
- Uses labeled data as input.
- Has a feedback mechanism.
- Most used algorithms: decision trees, linear and logistic regression.
Unsupervised learning:
- Uses unlabeled data as input.
- Does not have a feedback mechanism.
- Most used algorithms: k-means, hierarchical clustering, anomaly detection.
6. How do statistics and machine learning relate?
I see conflicting information everywhere. In the course I watch, they say that machine learning and statistics are one and the same thing in a different wrapper. At the same time, on the programmers forum they tell me that statistics and machine learning are completely different things. What should I do?
There is a technical overlap between statistics and machine learning. However, on a more abstract level, what separates them is that statistics is rooted in science, while machine learning is rooted in technology.
The basic idea behind ML is a technological system that uses past data to predict future outcomes. Machine learning is tightly tied to business problems and almost always relies on considerations of practicality, working only to predict future outcomes.
Statistics, on the other hand, has a different purpose. It is based on science, and is accordingly a scientific method that is used to explore (rather than predict) how the world works. Transparency and deeper understanding is what statistics strives for, while clear results and accurate predictions are what machine learning strives for.
7. When to use PCA in application tasks?
I recently found out about a method like PCA. It looks very cool, but I don’t understand at all when to use it. Is it just a “classic to know” and we never really use it?
If features within the data are weakly correlated, you shouldn’t use this method. The results will be poor and will not give you what you want. Analysing the data before and after PCA will give an accurate answer.
Don’t forget that PCA only shows results based on linear correlations. However, even if the “chips” are nonlinearly correlated, using PCA can help to varying degrees, as often nonlinear correlations imply weaker linear correlations.
At the same time, meticulously modelling each non-linear association is likely to lead to overfitting.
In summary: the PCA method is useful for dimensionality reduction when you have a set of features with linear correlation.
8. What is the difference between the data at different stages (training, validation and test)?
In your last article I read that we divide the data into three parts. Why do we do this? Isn’t it easier to train the model on all the data at once?
Training a model on all the data at once will inevitably lead to overfitting. This is why we divide the data into three parts:
- Training data – those on which your model is trained.
- Validation data – those on which your model is evaluated during training. The process is needed to improve the quality or detect flaws within the model after training.
- Test data – those on which your model is evaluated after training, after several iterations of model selection, hyperparameter tuning, etc. This is the last step to assess how well your model will perform in production.
9. What is the difference between normalisation and standardisation?
I’ve completed a couple of machine learning courses but still don’t understand the difference between normalisation and standardisation. What purpose do we use them for?
Normalisation, also known as min-max scaling, is a technique where all data values are converted so that they lie between 0 and 1.
The formula for normalisation:
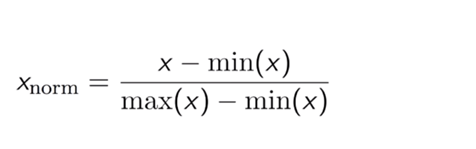
where max(x) is the maximum value of the attribute
min(x) is the minimum value of the attribute
Standardisation means transforming our data so that it has a normal distribution with a mean of 0 and a standard deviation of 1.
The standardisation formula:

Thus, normalisation scales the data exclusively between 0 and 1. Standardisation ensures that the data conform to a standard normal distribution.
10. What is the difference between xgboost and gradient boosting?
I’m trying to understand the key differences between classic gradient boosting and xgboost. Tried googling, but couldn’t find a good explanation between the two algorithms. And why does xgboost almost always work better than regular gradient boosting?
The main difference lies in the loss functions of each algorithm, as well as the metric you optimise during training. Gradient boosting attempts to minimise distance, such as the mean square error. XGBoost, on the other hand, is a more regularised form of gradient boosting. It uses a Bayesian approach. Also XGBoost uses improved regularisation (L1 and L2) which improves the performance and speed of model learning.
Conclusion.
We have touched on just a few important data science topics. What questions and challenges have you encountered while studying and working in Data Science?